Published on August 19, 2025 | Reading Time: 8 minutes Amibroker Crypto currency data Introduction:…
Amibroker : Stocks & Futures 🌏 Data Plugin…
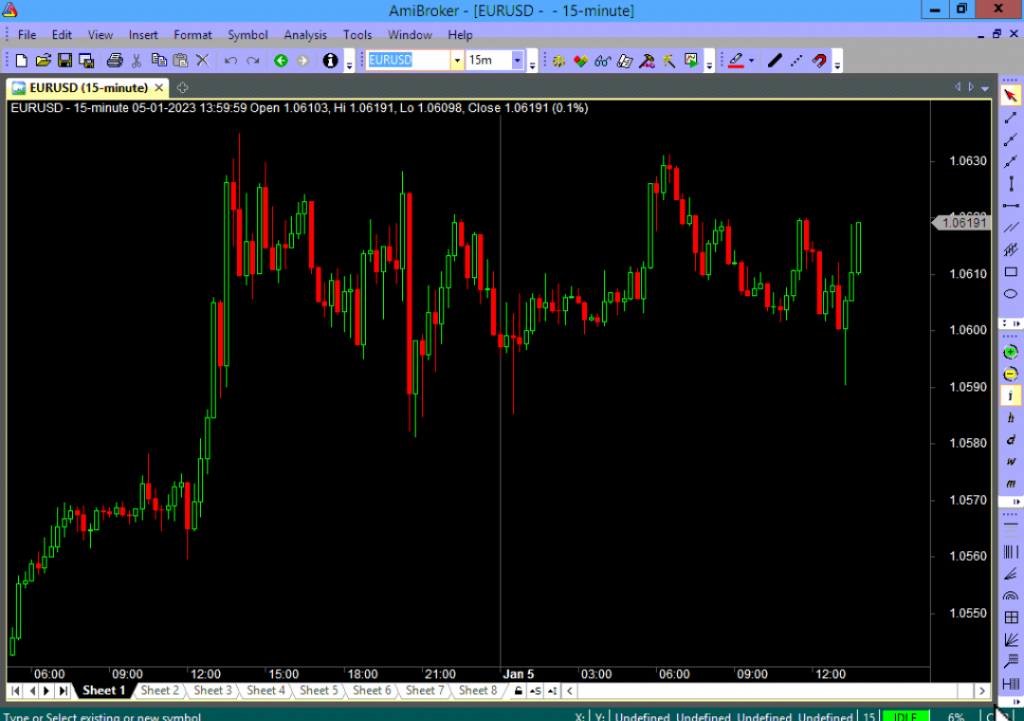
AmiBroker allows you to customize the appearance and layout of your charts in various ways, including:
- Choosing the type of chart: You can choose from different chart types, such as bar charts, candlestick charts, and line charts. Each type of chart has its own strengths and can be more or less suitable for different types of analysis.
- Setting the time frame: You can choose the time frame for your chart, ranging from very short-term (e.g. 1-minute bars) to very long-term (e.g. monthly bars). The time frame you choose will depend on your trading style and the type of analysis you are doing.
- Adding indicators and overlays: AmiBroker includes a wide range of technical indicators and overlays that you can add to your charts. These can help you identify trends, support and resistance levels, and other patterns that may be useful for your analysis.
By customizing the appearance and layout of your charts, you can create charts that are tailored to your specific needs and trading style. It’s important to keep in mind, however, that technical analysis is just one aspect of trading, and it’s always a good idea to consider a wide range of factors when making investment decisions.
